Let's examine the heat and enthalpy changes for a system undergoing physical change.
A good example that most people are familiar with is the heating of water. If we take a beaker filled with ice (solid water) and put in on a hot plate that has a temperature of 120 ° C we all know what will happen. First the ice will melt to liquid water. Then the water will increase in temperature. Then finally the water will boil. During this entire process the temperature of the hot plate will be higher than the temperature of the beaker of water. Thus, during this entire process energy will flow in the form of heat from the hot plate into the water. We would likely describe the water as the system and the hot plate as a constant temperature surrounding.
For this process, we are interested in the amount of heat that flows from surroundings into the system. Remember, heat can be tricky. When there is no chemistry or phase transitions, then energy flowing into a system in the form of heat will lead to a temperature change. However, when there is chemistry or a phase transition, then energy will flow in and the temperature can stay constant. Why doesn't the temperature go up? The energy coming in results in higher potential energy not higher kinetic energy. Breaking up the IMF between the molecules leads to a high potential energy.
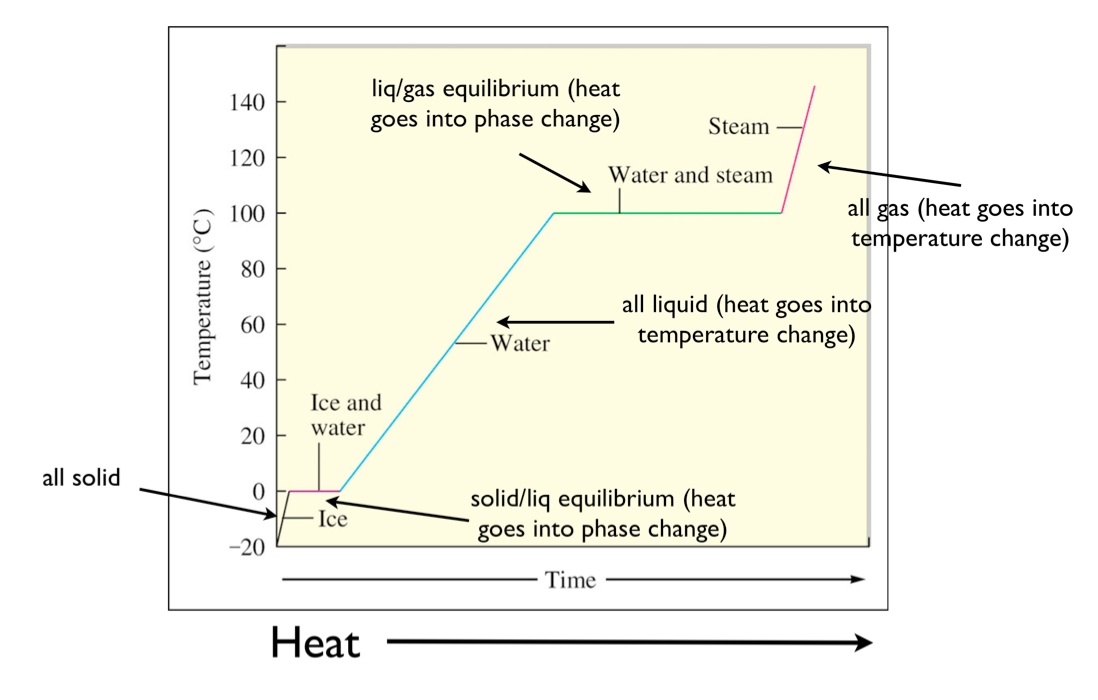
This can be easily seen in a heating curve that plots the temperature of a system as a function of the heat flow into the system. Initially the system is a solid, then it has a melting transition, then it is a liquid, then has a vaporization transition, and then it is a gas.
The diagram below shows the heating curve for water. The temperature of the system is plotted as function of time. Heat is flowing at a constant rate, thus time can be interpreted as heat.
Initially, the system is solid water at temperature of -20 °C. As the heat flows in, the temperature of the ice increases. The slope of this line is the heat capacity of solid water. Since this is at constant pressure then \(q = \Delta H = mC\Delta T\) where q is the heat, m is the mass, C is the specific heat capacity, and \(\Delta T\) the change in the temperature. As this graph is a plot of T vs q, the slope is actually 1/mC.
Next the solid melts. During this time the temperature is constant at 0 °C. Heat flows into the system, but the temperature does not change. At the start of this transition all of the water is solid. As heat flows into the system, the solid begins to melt into a liquid but the temperature stays constant. That is because the energy that is flowing into the system as heat is going into the potential energy of overcoming the intermolecular forces holding the water in a solid lattice. The length of the line at 0 °C is the amount of heat required to melt all of the solid into a liquid. This heat is called the enthalpy of fusion. Fusion is a specific scientific term for melting. You could call it the enthalpy of melting but instead it is called the enthalpy of fusion. The enthalpy of fusion is denoted as \(\Delta H_{fusion}\) and it typically is given in units of kJ mol-1. Thus the actual length of line will be \({n \times \Delta H_{fus}}\) since you'll need to multiply by the number of moles of solid to get the total heat of the phase transition.
Once all of the solid has been converted to liquid the temperature increases with heat flow. The slope of this line is again related to the heat capacity. However, this time it is the heat capacity of the liquid. Once the temperature reaches the boiling point of 100 °C the temperature is again constant as the liquid is converted to gas. The heat required to convert all the liquid to a gas is called the enthalpy of vaporization, \(\Delta H_{vaporization}\). You can see the heat required to vaporize water is significantly more than the heat required to melt water. This is true for most substances. Fusion involves simply breaking up the IMF to allow for translational motion of the molecules; vaporization requires essentially completely overcoming the IMF to move the molecules out of the condensed phase. Once all the liquid is converted to a gas, then the temperature increases with a slope related to the heat capacity of the gas.